Quality Factor Investing: A Comprehensive Guide
Factor investing, which involves incorporating different factors in an investment strategy, has gained significant popularity over the period. Understanding and applying factor-based strategies can make the difference between mediocre and outstanding portfolio performance.
One of the most reliable and time-tested factors is quality. Quality factor investing emphasizes businesses with solid financial foundations, such as steady profit growth and minimal debt level.
Read more about factor investing here, and stay tuned for insights on other factors.
Understanding Quality Factor
But what is quality factor investing? In essence, quality investing identifies companies that have strong financial health with potential for growth over the long-term. The main focus is to identify and invest in “High quality” companies rather than simply investing in cheap or undervalued stocks.
Quality investing is like choosing to grow a healthy plant instead of just grabbing the cheapest saplings. While those healthy trees might cost more upfront, they're likely to bear fruit year after year, weathering storms and climate changes. Over time, the orchard flourishes and provides consistent, reliable harvests, just as high-quality companies are expected to deliver steady returns in the long run.
Benefits of Quality Factor Investing
Quality should be a cornerstone in any well-rounded investment strategy because it has the potential to enhance expected returns while minimizing risk. Unlike other strategies that may chase high returns through volatile stocks, quality investing provides a more disciplined approach that prioritizes long-term success.
Quality investing essentially implies concentrating on stability and durability, which consequently decreases portfolio risk. Companies with solid financial standing and steady earnings are less likely to experience severe falls in stock prices amid market downturns.
Performance of Quality Factor Indices in the Global Market
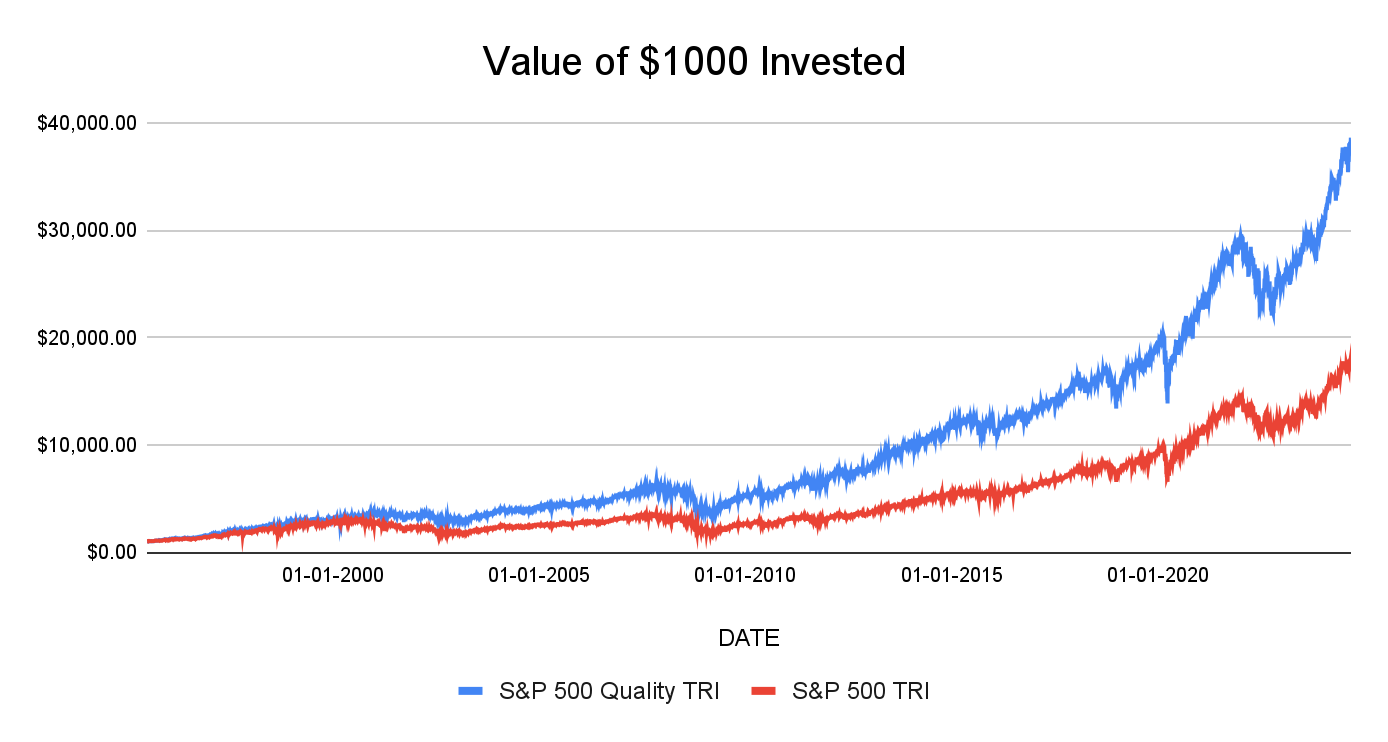
Historically, quality factor investing has performed well in India as well as the US. This graph suggests that the S&P 500 Quality index has significantly performed better than the S&P 500 index.

Past performance may or may not be sustained in future and is not an indication of future return. The above is only for illustration purposes and should not be construed as indicative return of offering of NJ Asset Management Private Limited.
Source: Internal research, Bloomberg, NJ’s Smart Beta Platform (in-house proprietary model of NJAMC). This chart depicts the growth in the NAVs of S&P 500 Quality factor based indices vis-a-vis that of the S&P 500 Index over the period 5th July 1995 to 31st August 2024. All the NAVs are in USD and have not been converted to INR. All the indices have been scaled to $1,000 as of 5th July 1995.
How is Quality Measured
Measuring “Quality” is one of the toughest challenges, as it can mean different things to different people. Unlike various parameters, no set quality factor formula provides a definitive answer. However, one effective way to measure quality is by assessing various financial metrics and indicators. Return on Equity (ROE), Dividend Payout Ratio, Current Ratio, and Debt-to-equity Ratio are a few common indicators.
-
Return on Equity
ROE measures a company’s profitability. A higher ROE indicates that a company is effectively using shareholders' equity to generate profits. To calculate return on equity, divide net income by shareholders’ equity.
-
Dividend Payout Ratio
A dividend payout ratio can be calculated as dividend per share (DPS) divided by earnings per share (EPS). A good dividend payout ratio would suggest that the company is returning value to shareholders while still retaining earnings to reinvest in the business.
-
Current Ratio
The current ratio indicates how easily a company can meet its short-term liabilities with its short-term assets. The higher the current ratio, the better is the short-term liquidity and working capital management of the company. Formula to calculate current ratio is dividing current assets by current liabilities. If the calculated value is above 1, it reflects strong short-term financial stability of the company.
-
Debt-to-Equity Ratio
Debt-to-equity ratio helps assess a company’s financial leverage. The value is obtained by dividing total liabilities by shareholders’ equity. Quality companies typically have low debt-to-equity ratios, indicating prudent management of debt and reduced financial risk.
NJ Quality+ Model
NJ Quality+ Model is an epitome of NJ Asset Management’s definition of quality.
NJ Quality+ Model, a 100% rule-based model, uses various parameters to segregate and rank stocks. An equal weighting model is constructed by selecting the top 100 stocks that exhibit high-quality characteristics from the universe of 500 companies.
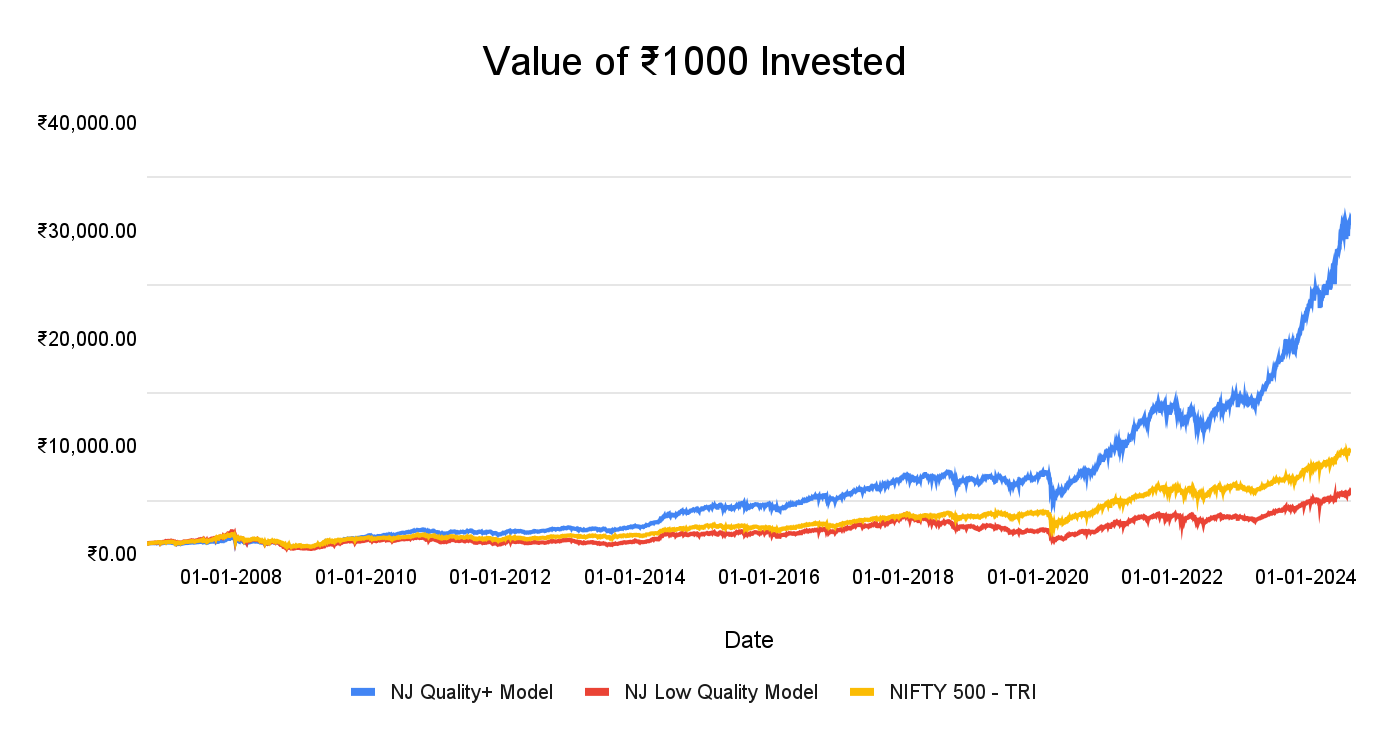
Furthermore, a Low-Quality Model is constructed using a methodology similar to the NJ Quality+ Model. The Low-Quality Model is a portfolio focusing on low-quality factor investing, juxtaposing the NJ Quality+ Model. In this model, bottom 100 quality stocks are selected, exhibiting the most inferior quality attributes. This allows for the comparison of the risk and return of extremely high-quality vs extremely low-quality stocks.
The following graph showcases that historically the NJ Quality+ Model has outperformed the Nifty 500 TRI as well as the NJ Low Quality Model, reflecting the superior propensity of high quality businesses to generate better returns in the long-term.

Past performance may or may not be sustained in future and is not an indication of future return. The above is only for illustration purposes and should not be construed as indicative return of offering of NJ Asset Management Private Limited.
Source: Internal research, Bloomberg, CMIE, National Stock Exchange, NJ’s Smart Beta Platform (in-house proprietary model of NJAMC). Calculations are for the period 30th September 2006 to 31st August 2024. NJ Quality+ Model and NJ Low Quality Model are in-house proprietary methodologies developed by NJ Asset Management Private Limited. The methodologies will keep evolving with new insight based on the ongoing research and will be updated accordingly from time to time. All the indices have been scaled to ₹1,000 as of 30th September 2006.
Other than the propensity to generate better returns or alpha, it is also sacrosanct to assess the downside protection during turbulent times for high-quality vis-a-vis low-quality companies.
The below tables showcase the maximum drawdown and recovery time to cover the drawdown of the NJ Quality+ Model and the NJ Low Quality Model over three different time frames. A maximum drawdown (MDD) showcases the decline from a portfolio's highest value to its lowest point before it reaches a new peak. This suggests that portfolios with high-quality stocks have lower drawdowns while also taking less time to recover.

Past performance may or may not be sustained in future and is not an indication of future return. The above is only for illustration purposes and should not be construed as indicative return of offering of NJ Asset Management Private Limited.
Source: Internal research, Bloomberg, CMIE, National Stock Exchange, NJ’s Smart Beta Platform (in-house proprietary model of NJAMC). Calculations are for the period 30th September 2006 to 31st August 2024. NJ Quality+ Model and NJ Low Quality Model are in-house proprietary methodologies developed by NJ Asset Management Private Limited. The methodologies will keep evolving with new insight based on the ongoing research and will be updated accordingly from time to time.
Conclusion
Quality factor investing is an important approach to constructing a successful portfolio. Focusing on quality companies increases the potential to achieve long-term risk-adjusted returns. Quality investment not only offers stability during market downturns but also provides consistent returns in various economic conditions.
As the investment landscape continues to evolve, the enduring value of the quality factor remains clear. By integrating quality factors into a broader investment strategy, investors can develop a more resilient and successful portfolio by minimizing risks.
FAQs
1) What is a quality investment approach?
Quality factor investing aims to concentrate on companies with good financial health and stability that can potentially generate high returns in the long-term.
2) What are the metrics of quality investment?
Key metrics used to measure quality factors include Return on Equity, Dividend Payout, Current Ratio, and Debt-to-Equity Ratio.
3) What are the benefits of quality investing?
Lower risk, sustainable returns, and resilience during economic downturns are a few of the key benefits of quality factor investing.
Investors are requested to take advice from their financial/ tax advisor before making an investment decision.
MUTUAL FUND INVESTMENTS ARE SUBJECT TO MARKET RISKS, READ ALL SCHEME RELATED DOCUMENTS CAREFULLY.
« Previous Next »