Value Factor: Unlocking the Potential of Undervalued Stocks
There is always a need to find investment strategies that provide higher risk-adjusted returns. One strategy that has proven resilient over time is value factor investing. The goal of this approach is to find undervalued stocks- priced below their intrinsic value -and invest in them.
By unlocking the potential of these undervalued stocks, value factor investing provides investors with an opportunity to achieve better returns. But what exactly is the value factor, and how can you harness its potential to grow your portfolio?
Know More About Value Factor
Value factor investing is like finding a hidden gem in a crowded marketplace. Envision exploring a crowded marketplace where shoppers are drawn to lavish, costly goods on exhibit. On the other hand, most people tend to ignore real gems. Comparably, value factor investing is about being able to identify these little-known treasures, recognizing their potential before others do, and investing in them before they gain wider attention.
The value factor is a fundamental concept in factor investing that refers to the practice of selecting stocks that appear to be undervalued relative to their intrinsic value. The underlying tenet of this strategy is that the market will ultimately uncover its true potential, raising the stock price.
Quantifying Value Factor
Measuring the value factor involves evaluating several financial metrics that help compare a company’s current market value with its ‘true’ intrinsic value. Among the parameters that are most frequently utilized are:
-
Price to Earnings
The Price to Earnings (P/E) ratio compares a company's current stock price to its earnings per share. It indicates the price an investor has to pay today to get one rupee of earnings per share from that company. A stock would be considered undervalued if it has a lower P/E ratio.
-
Price to Book
The Price to Book (P/B) ratio compares the market value of a company’s stock to its book value. A lower P/B ratio may indicate that the stock is undervalued relative to its book value of equity, also commonly referred to as net assets or net worth.
-
Dividend Yield
The Dividend Yield compares a company’s dividend per share to its current market price and reflects the yield (i.e. return) that an investor could generate through dividends/income from the company by investing in its stock today. Stocks with high Dividend Yields are generally regarded as undervalued and high-income stocks.
-
Price/Earnings to Growth
The Price/Earnings to Growth (PEG) ratio refines the Price to Earnings (P/E) ratio by taking a company’s earnings growth into account. It is calculated by dividing the P/E ratio by the company’s expected earnings growth rate. A lower PEG ratio indicates that the stock may be undervalued relative to its growth potential.
Value Factor and Smart Beta Investing
The value factor is closely related to Smart Beta investing. The Smart Beta strategy aims to beat market indices by concentrating on specific factors.
A value-focused Smart Beta strategy employs a rule-based methodology to invest in undervalued stocks. This transparent and systematic method aims to capitalize on the opportunity presented when the market recognizes the stock's true value.
Historical Performance of Value Factor Investing
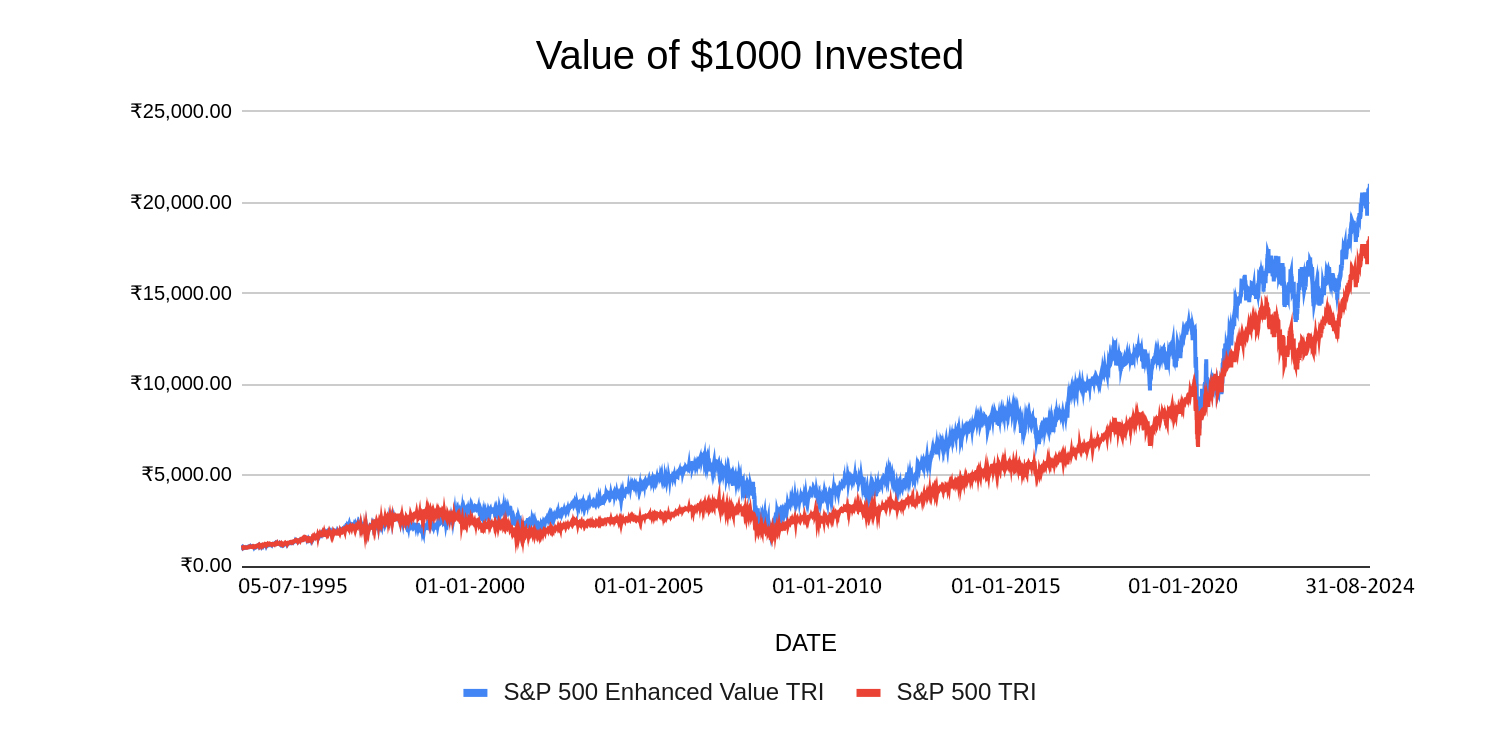
Across the globe, value factor investing has showcased impressive returns. The data reveals that the S&P 500 Enhanced Value Index has achieved substantially better performance compared to the S&P 500 Index. The same is portrayed in the graph below showcasing the growth of $1,000 invested over the period.

Past performance may or may not be sustained in future and is not an indication of future return. The above is only for illustration purposes and should not be construed as indicative return of offering of NJ Asset Management Private Limited.
Source: Internal research, Bloomberg, NJ’s Smart Beta Platform (in-house proprietary model of NJAMC). This chart depicts the growth in the NAVs of S&P 500 Enhanced Value factor based indices vis-a-vis that of the S&P 500 Index over the period 5th July 1995 to 31st August 2024. All the NAVs are in USD and have not been converted to INR. All the indices have been scaled to $1,000 as of 5th July 1995.
NJ Enhanced Value and NJ Traditional Value
NJ Traditional Value and NJ Enhanced Value represent two distinctive models developed by NJ Asset Management Company, each offering a unique approach to harnessing the value factor in investing.
The NJ Enhanced Value model uses a Discounted Cash Flow (DCF) model to evaluate a company's earnings growth in relation to its implied growth rate. A stock is considered undervalued when the growth rate needed to bring the intrinsic value in line with the current price is less than the historical growth of the stock.
The NJ Traditional Value model selects stocks based on certain traditional value parameters viz. P/E ratio, Dividend Yield, etc. Both models select the top 100 value stocks from the universe of 500 stocks and build an equal-weighted portfolio.
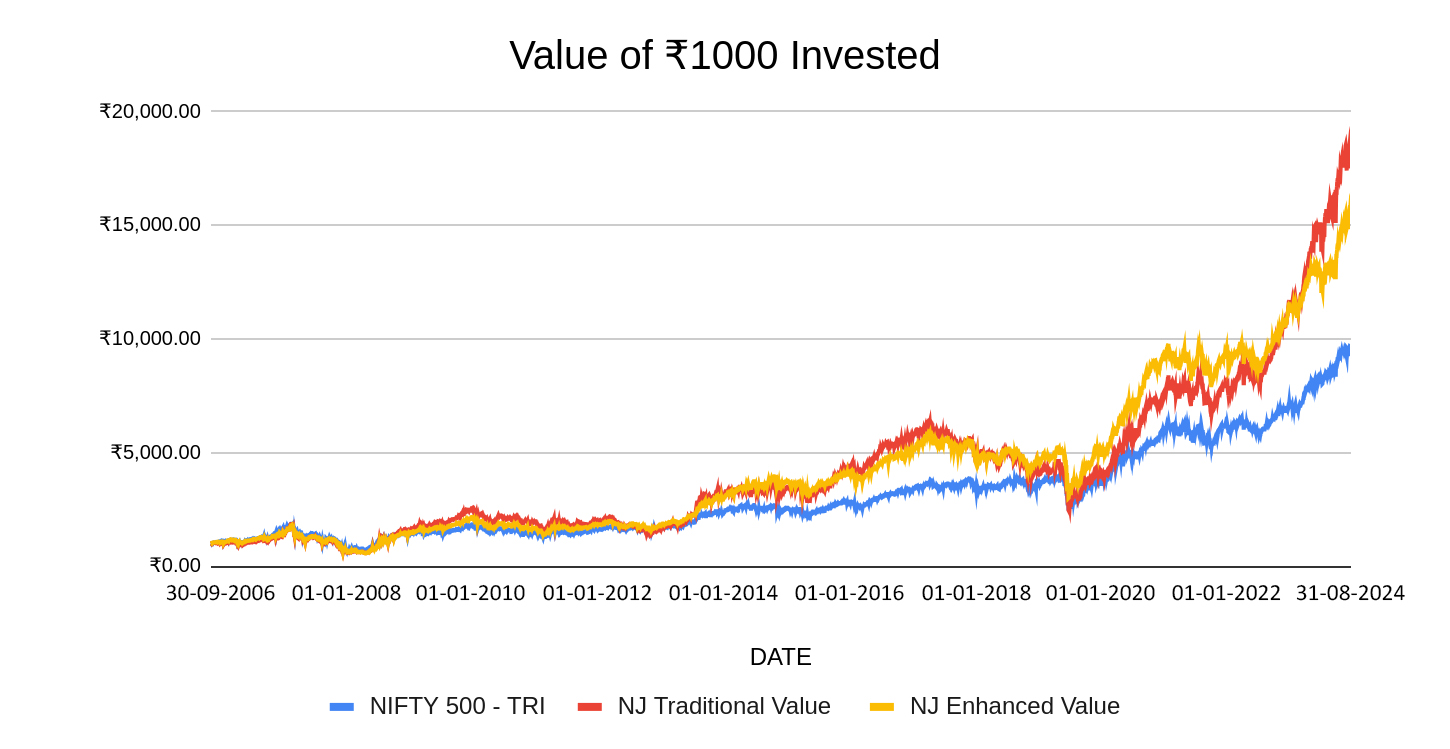
The graph below illustrates that, historically, the NJ Enhanced Value Model and NJ Traditional Value have delivered better performance than the Nifty 500 TRI index, emphasizing the long-term return potential of undervalued businesses.

Past performance may or may not be sustained in future and is not an indication of future return. The above is only for illustration purposes and should not be construed as indicative return of offering of NJ Asset Management Private Limited.
Source: Internal research, Bloomberg, CMIE, National Stock Exchange, NJ’s Smart Beta Platform (in-house proprietary model of NJAMC). Calculations are for the period 30th September 2006 to 31st August 2024. NJ Enhanced Value Model and NJ Traditional Value Model are in-house proprietary methodologies developed by NJ Asset Management Private Limited. The methodologies will keep evolving with new insight based on the ongoing research and will be updated accordingly from time to time. All the indices have been scaled to ₹1,000 as of 30th September 2006.
Conclusion
In conclusion, the value factor is an integral part of smart beta investing. Pioneered by legendary investors like Benjamin Graham, David Dodd, and Warren Buffett, the value investing strategy is deeply rooted in core fundamentals and financial statement analysis of companies, thereby giving it a strong economic rationale for investment.
While the market may sometimes overlook these hidden opportunities, investors deploying a value factor strategy can benefit from it. The value factor strategy has proven effective across different markets and periods, outperforming traditional benchmarks over the long term.
FAQs
1) How is the value factor measured?
Key financial parameters used to measure value factors include Price-to-Earnings (P/E), Price-to-Book Value (P/B), Dividend Yield, and others.
2) Can value factor investing be combined with other strategies?
Yes, value factor can be combined with other factors to create a multi-factor investing strategy. Multi-factor investing combines different factors into one strategy to diversify risk.
3) What are the risks associated with value investing?
Risks associated with the value factor could be the potential for a stock to remain undervalued or decline further, sometimes for very long periods, until the market realizes its intrinsic value. Additionally, value stocks may be more susceptible to downturns in specific industries or economic conditions. However, a rule-based approach can potentially help mitigate the risks.
Investors are requested to take advice from their financial/ tax advisor before making an investment decision.
MUTUAL FUND INVESTMENTS ARE SUBJECT TO MARKET RISKS, READ ALL SCHEME RELATED DOCUMENTS CAREFULLY.
« Previous Next »